- Inverse
- Posts
- Why US stocks may be in a bubble
Why US stocks may be in a bubble
Historically inflated valuations and a worsening outlook create a dangerous combination
Sumeet Ganju
September 09, 2025 • Estimated Reading Time: 8 minutes

🔥 By any metric, the S&P 500 has never been this over-valued
S&P 500 Valuation
Source: InverseWealth Research1
For the past 15 years, the S&P 500 (and the US stock market in general) has been the big daddy of investment returns - and created an aura of invincibility.
Even this year, amid all the uncertainty of tariffs and recession calls, the S&P 500 is up 11%. Nothing seems to shake the faith.
As an investor, you may be tempted to think that normal service has resumed. However, dive deeper under the surface and it’s clear that things are anything but normal.
The last time we had valuations this high, we ended up with the dot com crash. Based on objective metrics, the S&P 500 could well be in bubble territory.
If your portfolio is 80-90% US stocks, you should read on to understand the risk to your portfolio.
💰️ Why valuations are important
In the era of passive investing, it seems that no one cares about valuations. However, valuations have historically been a good predictor of future returns.
The logic is simple and fairly intuitive.
If you want good returns, you should buy low and sell high. Buying at a high valuation means that you are doing the opposite - you are overpaying for the asset. And your future returns will most likely be lower.
Public stock valuations are typically represented by the P/E ratio i.e. the price-to-earnings ratio. It represents the number of years it would take for an asset to return your investment based on current profit (earnings).
However, the P/E ratio doesn’t take into account future expectations of growth or other reasons that might justify a high valuation.
We therefore used several different industry-standard valuation metrics to build a valuation score that provides a more holistic view of stock valuations
🎯 InverseWealth valuation score
We created a composite valuation score based on the following industry-standard valuation metrics:
CAPE Ratio
Buffet Indicator
Trailing P/E
Forward P/E
Price / Book
Price / Sales
We then assigned a weightage to each of these metrics based on academic research and predictive power to create a composite valuation score (0-100).
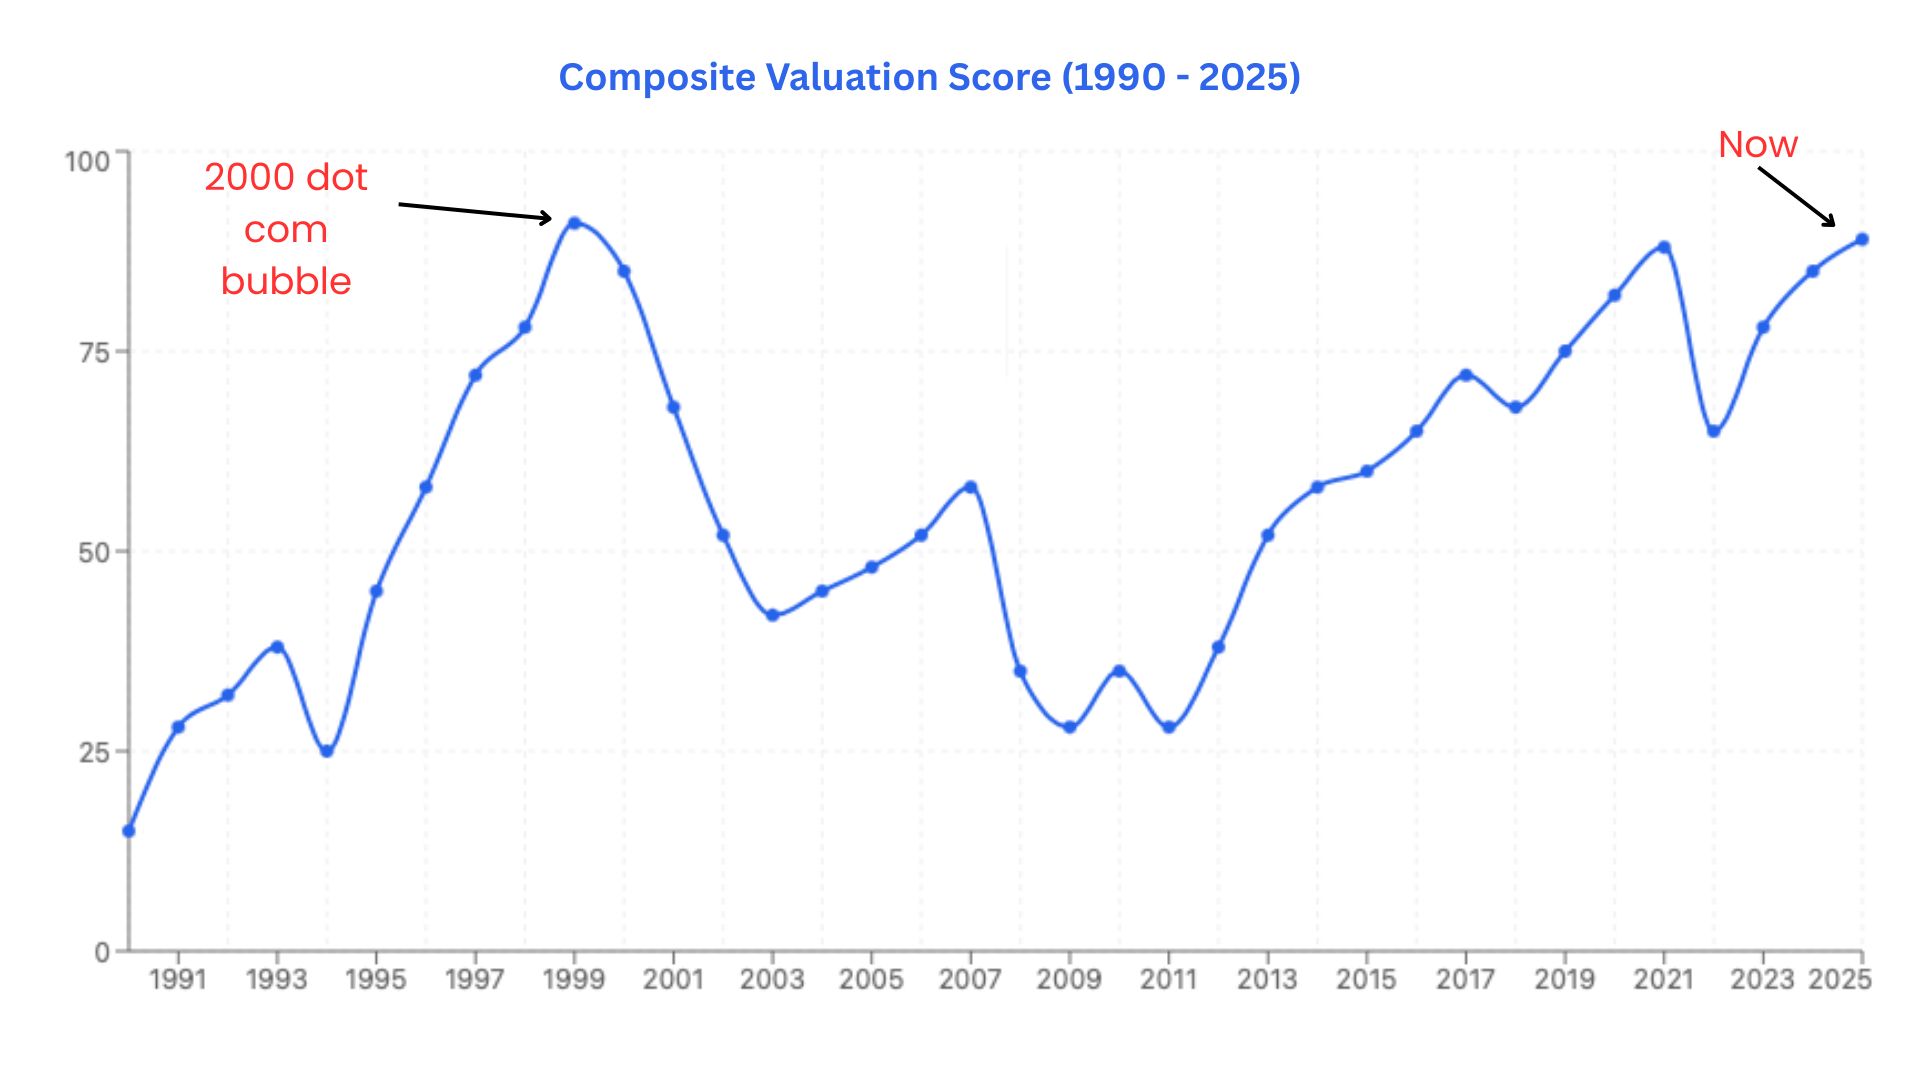
A score ~75 or higher indicates significant over-valuation with a high probability of poor 10-year returns.
📈 The Results

The dot com bubble had a peak valuation score of 91. By those standards, we are in rarefied territory.

S&P 500 Valuation
Source: InverseWealth Research1
If you are curious, below is a snapshot of the underlying metrics that make up this score. Most underlying valuation metrics are at historically inflated levels.
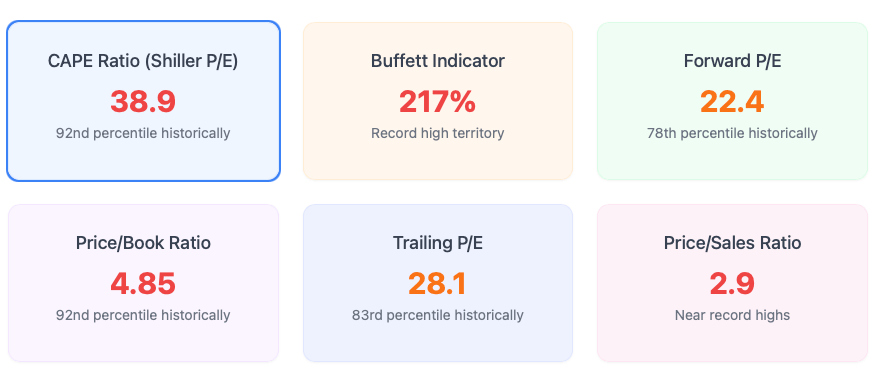
S&P 500 valuation metrics
Source: InverseWealth Research1
🧭 Indicators from the real economy
Excessive valuation is often a sign of irrational exuberance.
But what causes bubbles to pop? It’s generally some unexpected bad news and a collective realization that things aren’t as rosy in the real world.
We’ve compiled a list of four economic trends that might help shine a light on the current state of affairs in the real world.
🏠️ Housing
Housing inventory piling up is generally the first sign of trouble. The overall US housing market appears stable. However, troubling signs are starting to appear.
The inventory of unsold newly built homes is currently at a 15-year all-time high, and going higher each month.
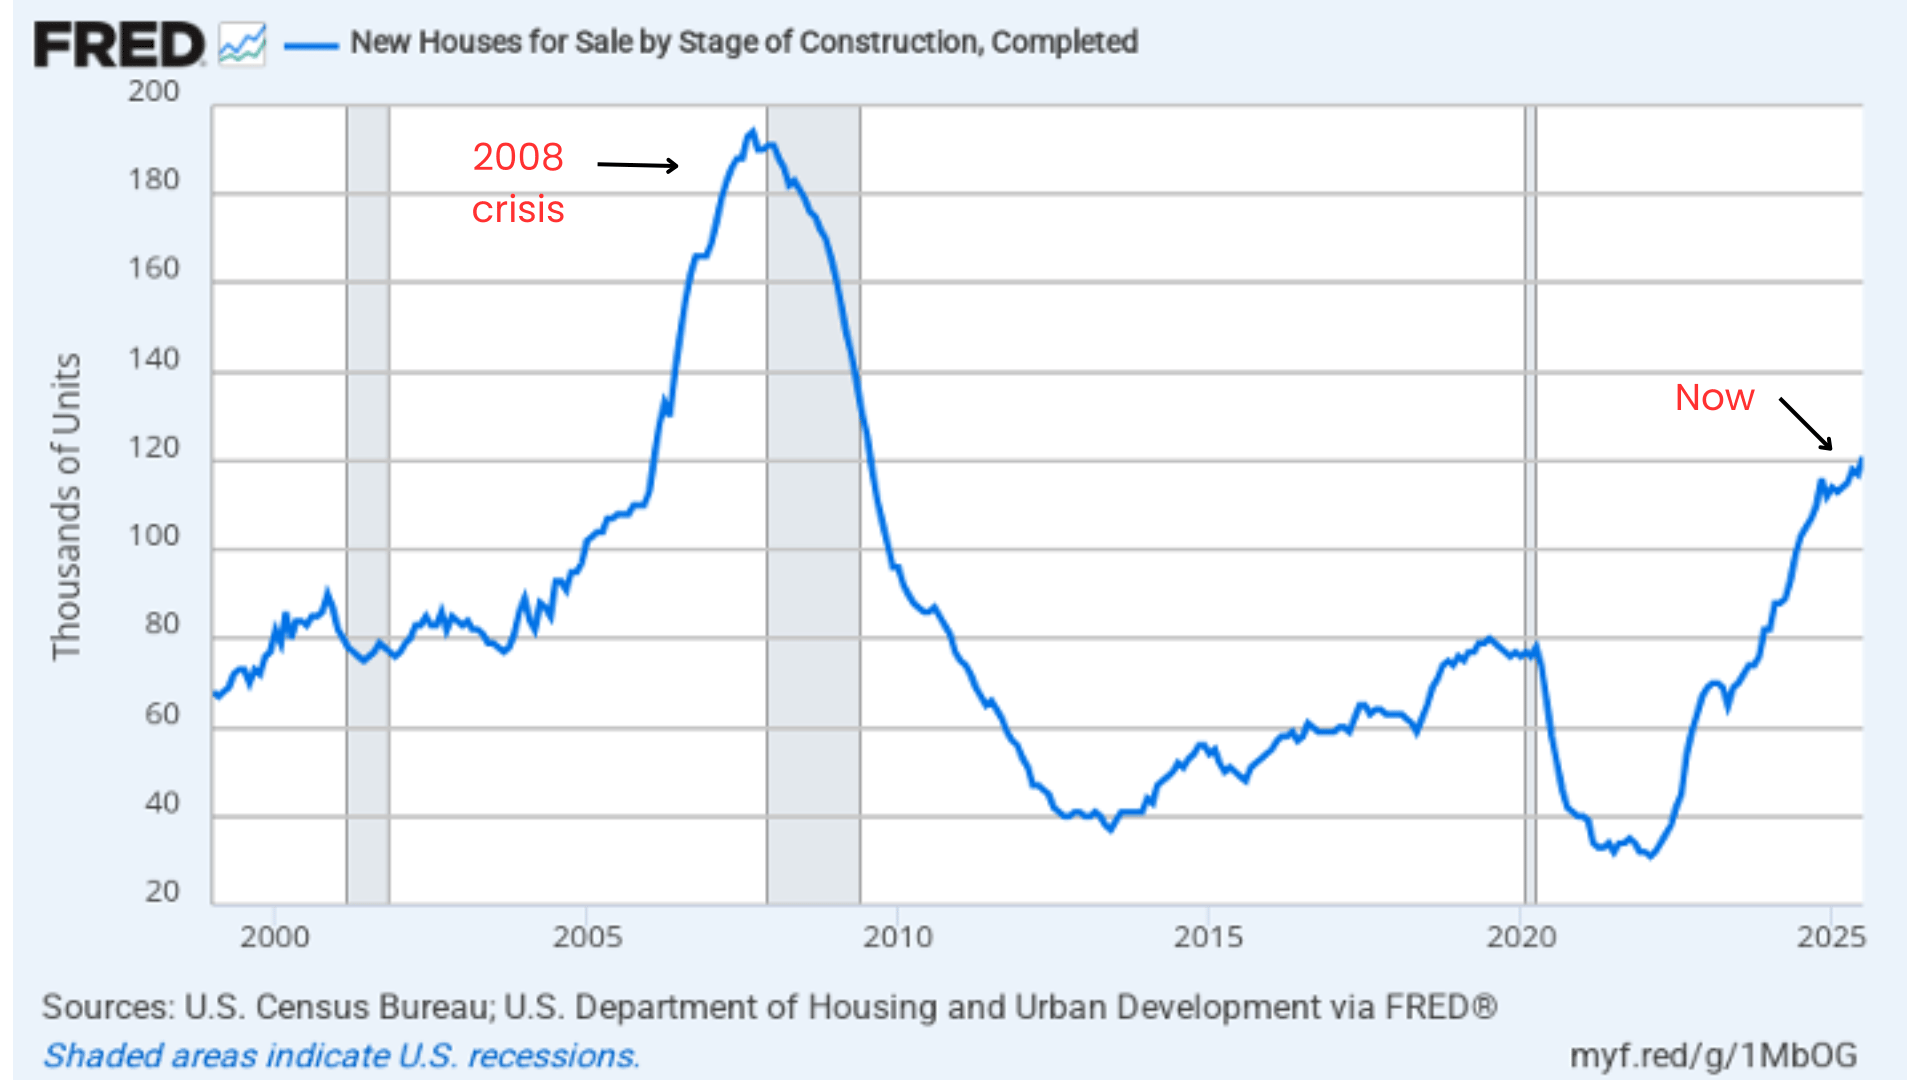
US new home unsold inventory
When new homes pile up, they create a downward pressure on home prices. Builders may delay upcoming projects, which in turn leads to lower construction jobs and a drag on the overall economy.
🧑🎓 Student Debt
Student debt delinquencies are growing at a fast rate. Currently, out of the number of borrowers that need to make payments, 23.7% (nearly 1 in 4 people) are seriously delinquent (90+ days late)
The chart below shows the incredible rate at which student debt is starting to turn delinquent (as a percentage of overall consumer debt)

Student Debt Delinquency
If this continues, we may soon see these delinquencies turn into defaults at one of the fastest rates ever.
Student debt defaults are serious - the government starts garnishing your wages, and your credit score takes a significant hit (credit score can decline by 170+ points ). Furthermore, student debt cannot be discharged through bankruptcy. It has to be paid off.
Student debt defaults can create a vicious downward spiral. Consumers have less cash in hand due to wage garnishments. At the same time, dings to their credit score can jack up the interest rate on their credit card balances and cutoff access to credit when it’s most needed.
💳️ Credit Card Delinquencies
US Credit Card delinquencies are now at about 3% and have gone above the pre-pandemic average. If they climb to more than 4.5%, it would be a worrying sign of growing economic distress.
The good news is that we aren’t there yet, and that delinquencies have stabilized in recent months.
However, an exploding student debt crisis could easily spill over into credit card delinquencies as well. It’s a trend that’s worth watching closely.
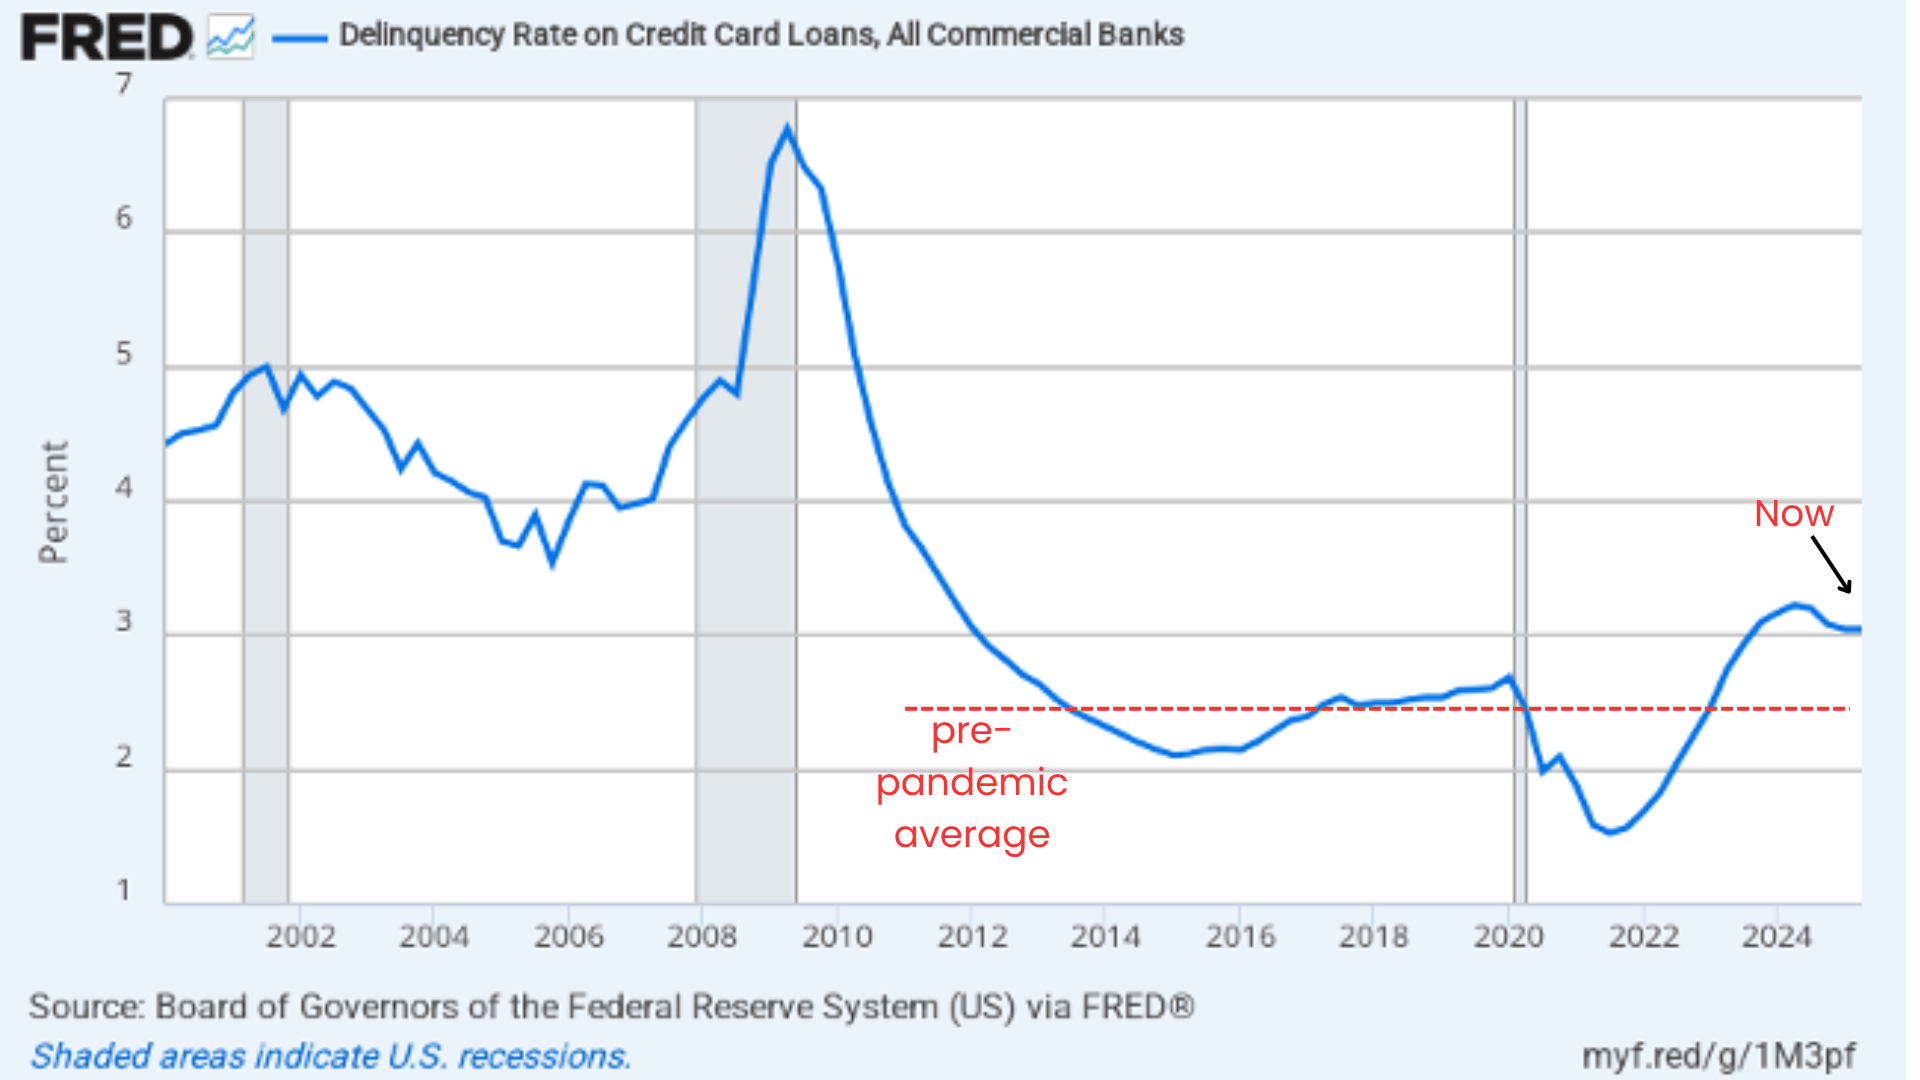
US Credit Card Delinquency Rate
🪓 Employment & Job Growth
Over the past year, US job growth has materially slowed down. Slowing job growth is a strong indicator of weaker economic outlook.
The 3 month average job growth metric is currently at a level that has consistently (but not every time) foreshadowed a recession.
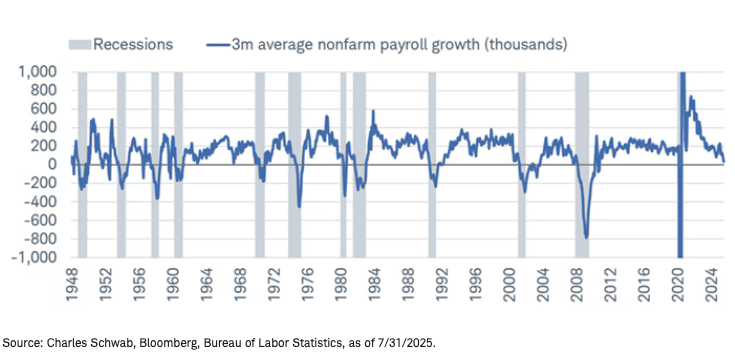
US Job Growth Rate
What does all of this mean? And what should you do?
The combination of extreme valuations and a worsening economic outlook is generally a bad sign for future stock performance.
However, it’s important to emphasize that just because valuations are high or extreme, it does not mean that a stock market crash is imminent. Valuations are not a great timing tool, but instead serve as an indicator of future return expectations.
Traders have a saying - “Markets can stay irrational, longer than you can stay solvent”.
The best defense is to have a diversified portfolio that has the right mix of diversified assets. And to not have a majority of your investments in risky assets.
Everyone seems to have forgotten that stocks are a risky asset. And that’s usually what gets us into trouble.
Till next time,
Sumeet @ InverseWealth
Reply